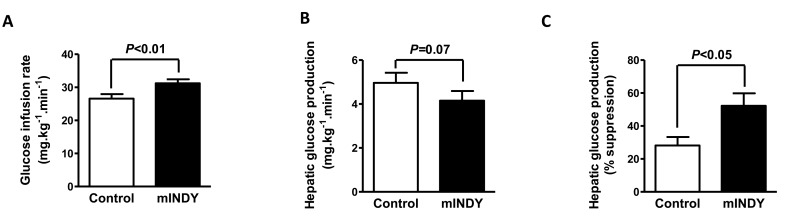
Figure 3.(A) Glucose infusion rate during the hyperinsulinemic-euglycemic clamp (HEC) is increased in mIndy ASO treated rats. (B) Trend for reduced hepatic glucose production during the HEC in the mIndy ASO treated rats. (C) Suppression of hepatic glucose production during the HEC was increased in mIndy ASO treated rats as compared to the control group. All data are mean ± SEM, N=10 for each group; significances by double sided t-test.