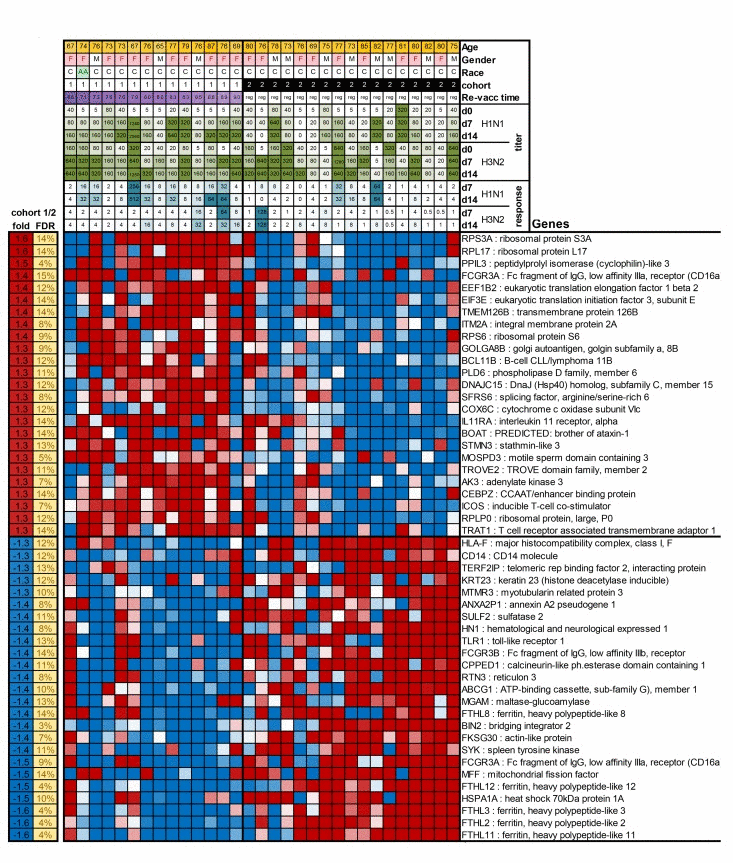
Figure 3.The Figure shows as a heatmap the top 50 genes that are differentially expressed between cohort 1 and 2In the top of the graph information is provided on patient characteristics, antibody titers before, and on day 7 and 14 after vaccination, and increases in responses after vaccination.