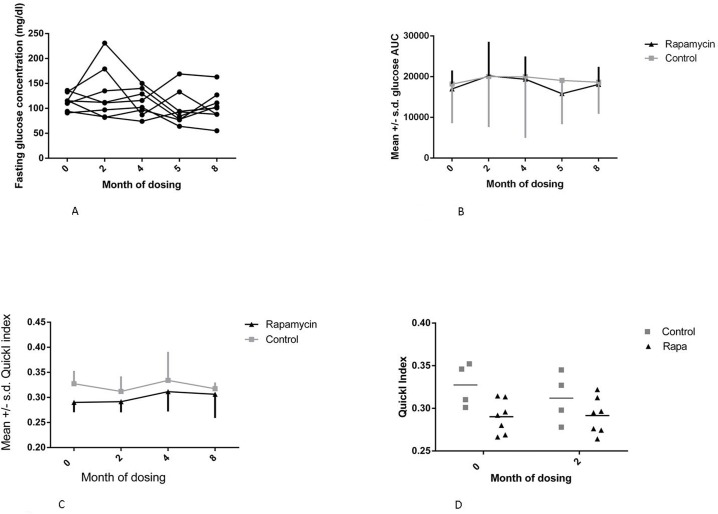
Figure 5.Metabolic measures(A) Fasting glucose concentration for months 0-8 for rapamycin subjects, month 0 is a pre-dosing measurement. (B) Glucose area under the curve (AUC) for months 0-8 for rapamycin subjects. (C) QuickI index for rapamycin subjects for months 0-8. (D) QuickI index - 1/[log(fasting insulin) + log(fasting glucose)] for months 0 and 2 of dosing, *(F=5.396, p = 0.0453, Sidak's multiple comparison test, p < 0.05 for month 0 control vs rapamycin treated). For all panels squares = control subjects; triangles = rapamycin subjects (mean ± SD).