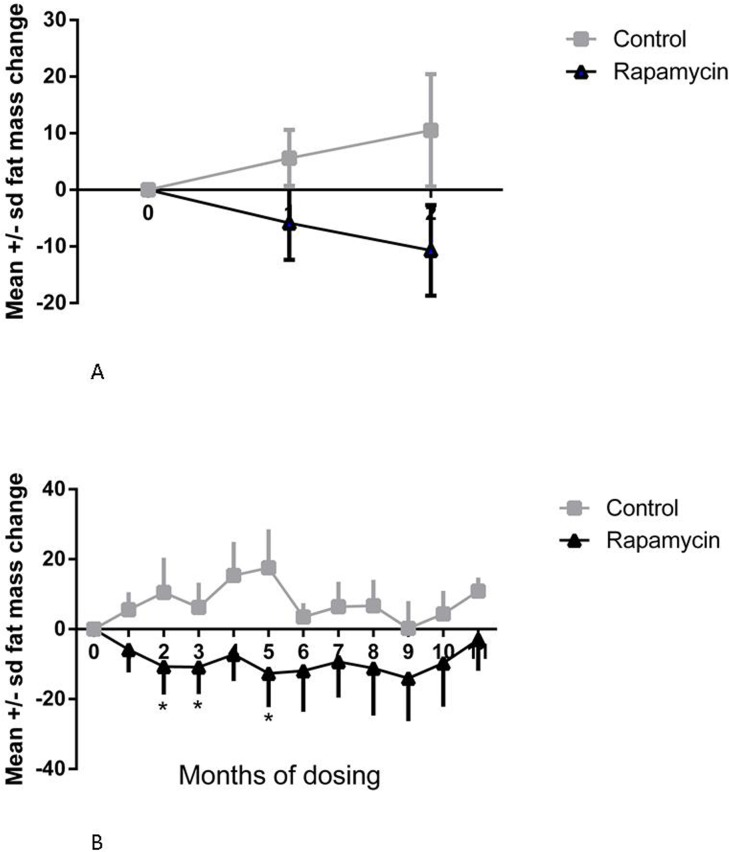
Figure 1.Change in fat mass(A) Change in fat mass at 1 and 2 months, post-dosing, from pre-dosing (month 0) measurement. Squares = control subjects; triangles = rapamycin subjects (mean ± SD); treatment × time interaction, p < 0.0097; difference in month 0 and month 2 mean for rapamycin treated subjects, p < 0.05, Sidak's multiple comparison test. (B) Change in fat mass from pre-dosing measurement for months 1-11 for rapamycin subjects. * treatment effect, F=5.385, p=0.018, Dunnett's multiple comparison test significant, p < 0.05, for month 0 versus months 2, 3, and 5.