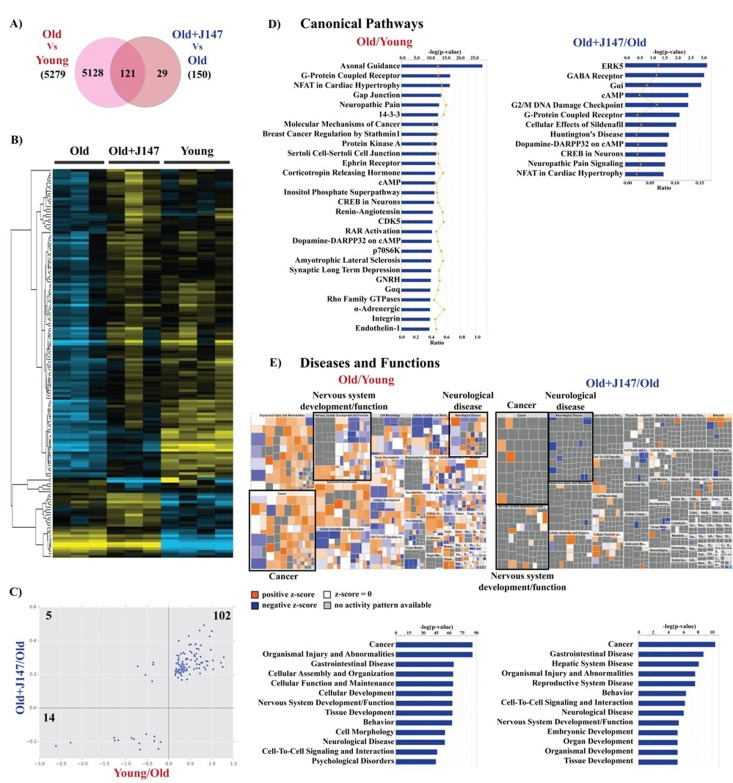
Figure 7.Whole transcriptome analysis of hippocampus shows a rescue of some age-related changes in RNA expression by J147(A) Venn diagram illustrating shared and uniquely affected genes. (B) Heatmap of the 150 genes found significantly modified between Old, Old+J147 and Young SAMP8 mice. Scaled expression value (Z-score) is plotted in yellow-blue color scale with yellow indicating high expression and blue indicating low expression. (n = 3-4/group). (C) Correlation of gene expression altered in Young/Old and Old+J147/Old (units are -log(fold change)). Predicted canonical biological pathways (D) and diseases/functions (E) associated with the alterations in gene expression. Only the top significant pathways are indicated.