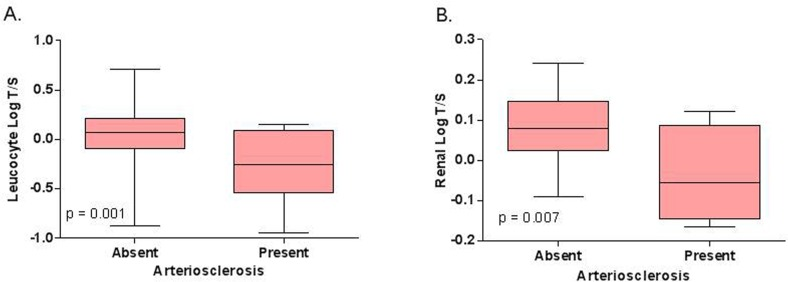
Figure 1.Relation between (A) leucocyte telomere length and renal arteriosclerosis in Cohort 1 (N = 130) and between (B) intrarenal telomere length and renal arteriosclerosis in Cohort 2 (N = 40). The p‐values represent nonparametric ANOVA. The horizontal lines within the boxes indicate means, the upper and lower ends of the boxes indicate standard deviations, and the whiskers indicate 95th percentiles.