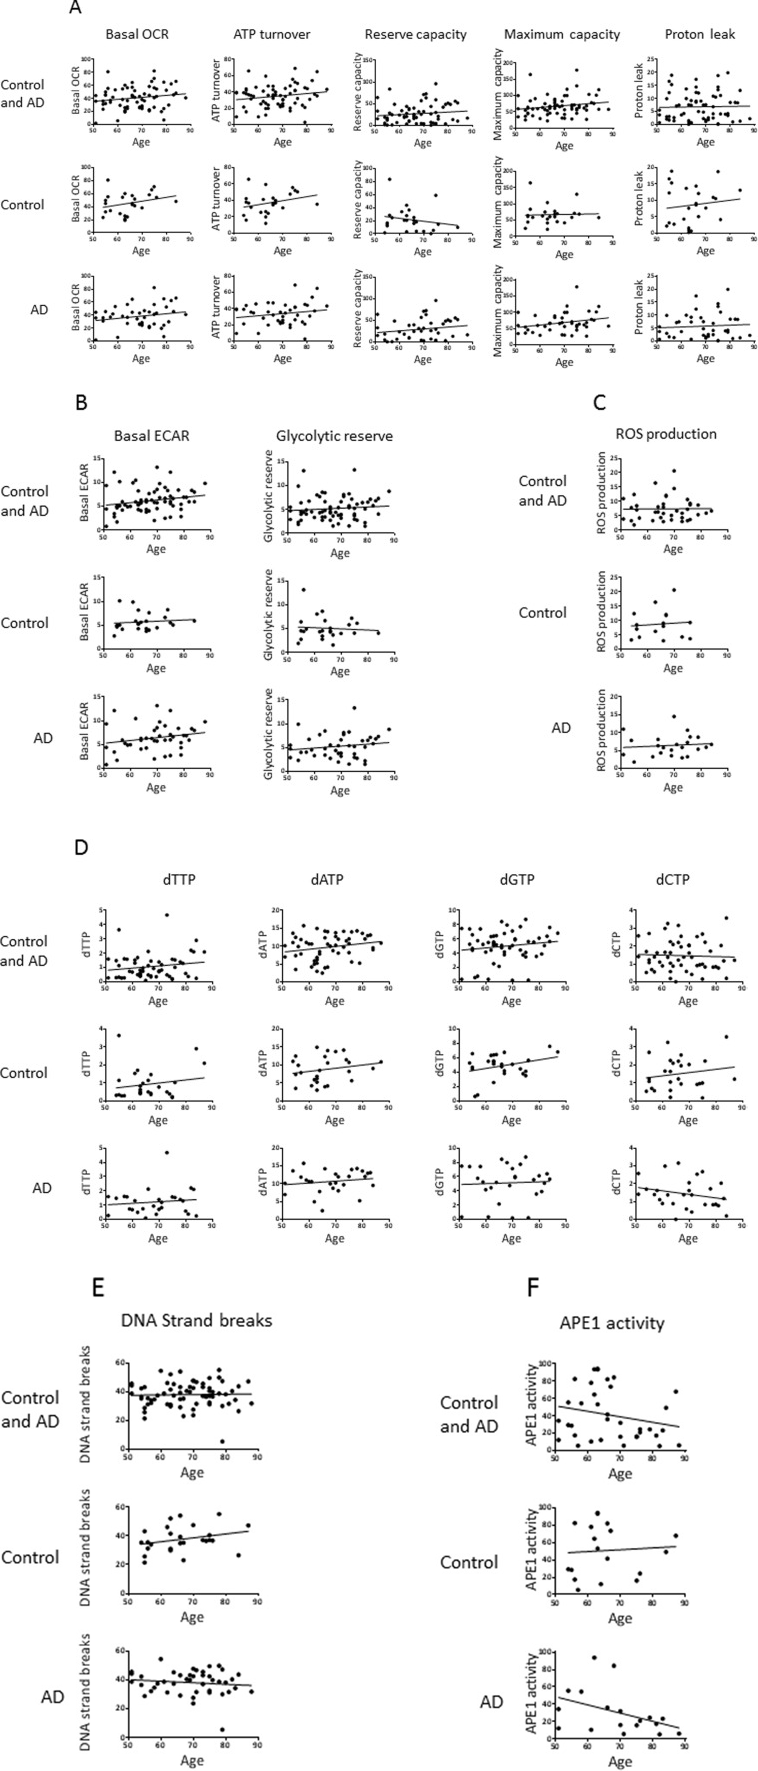
Figure 3.Effects of age on the values of the biochemical parameters in controls and AD participantsPearson correlation analysis of age with (A) OCR parameters, (B) ECAR parameters, (C) ROS production, (D) dNTPs, (E) DNA strand breaks, (F) APE1 activity. Units: OCRs (Basal OCR, ATP turnover, Reserve capacity, Maximum capacity, Proton leak), pmol oxygen/min; ECARs (Basal ECAR, Glycolytic reserve), mpH/min; ROS production, fluorescence; dNTPs, pmol/million cells; DNA strand breaks, percent fluorescence; APE1 activity, percent incision.