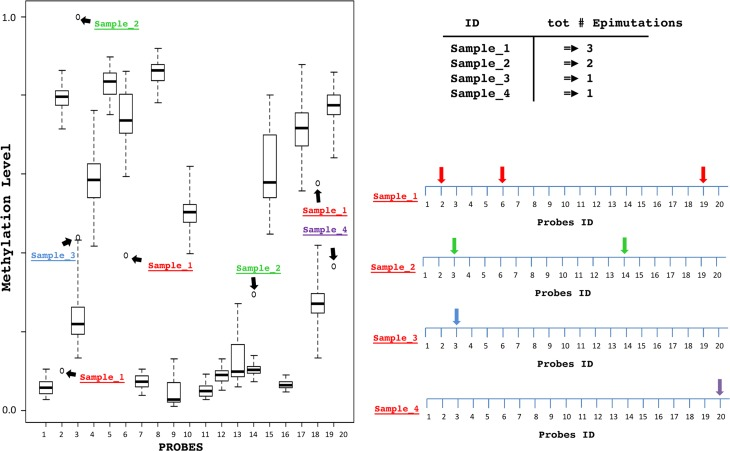
Figure 2.Schematic description of the SEMFor each probe, a Box-and-whiskers plot analysis identifies extreme outliers samples. For each sample epimutations are detected, counted and mapped considering their genomic position.
Figure 2 — Stochastic epigenetic mutations (DNA methylation) increase exponentially in human aging and correlate with X chromosome inactivation skewing in females | Aging