Submit an Article
Navigate
Home
Editorial Board
Editorial Policies
Current Volume
Archive
Scientific Integrity
Publication Ethics Statements
Interviews with Outstanding Authors
Newsroom
Sponsored Conferences
Podcast
Contact
Special Collections
Submit an Article
Online ISSN: 1945-4589
Research Paper
|
Volume 7, Issue 8
|
pp. 568–578
Stochastic epigenetic mutations (DNA methylation) increase exponentially in human aging and correlate with X chromosome inactivation skewing in females
Back to article
Figure 1
(1 of 4)
−
100%
+
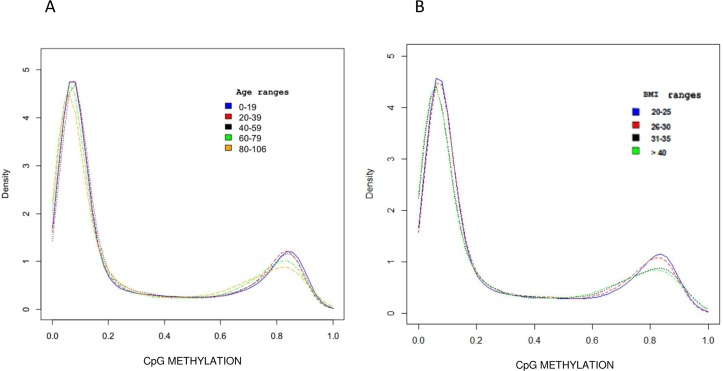
Figure 1.
DNA Methylation profile distribution
The density plot describes the mean methylation profile of samples grouped by age range
(A)
and by BMI range
(B)
.