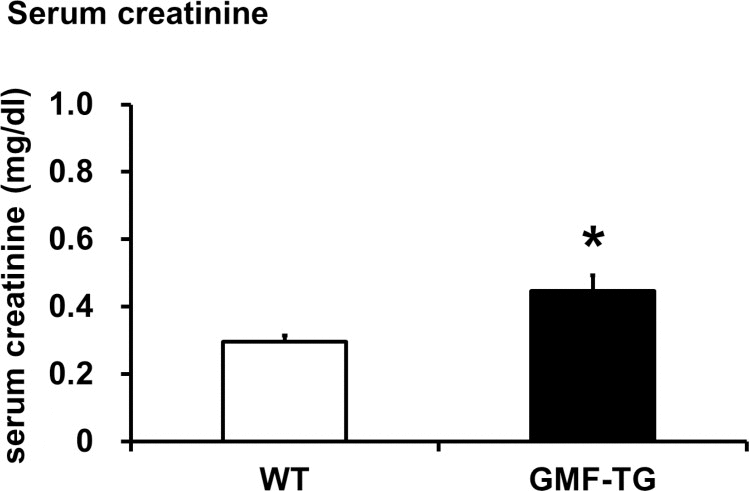
Figure 8.The serum creatinine levels in WT and GMF-TG miceThis figure shows the result of the serum creatinine levels in the WT and GMF-TG mice, which revealed that serum creatinine was increased in the GMF-TG mice, compared with the WT mice. The data is shown as means ± S.E. (WT; n=4, average age; 84.8 ± 0.25 weeks, GMF-TG; n=4 average age; 72.8 ± 6.24 weeks). *; P < 0.05 vs. WT mice.