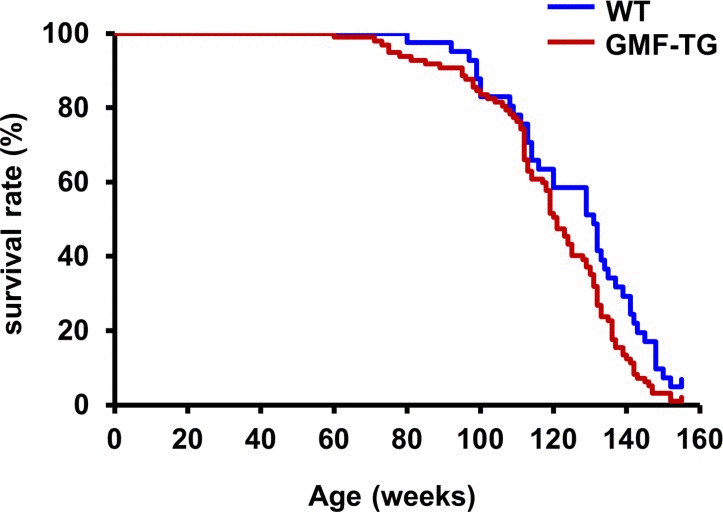
Figure 3.Kaplan-Meier graph of WT and GMF-TG miceThis figure shows a Kaplan-Meier representation of the survival curves, which revealed that the GMF-TG mice died significantly earlier than the WT mice. The GMF-TG mouse and the two wild-type mice were alive when the data analysis was performed. None of the mice exhibited any signs of distress or pain due to the clinical symptoms used to assess health and welfare. (WT; n=41, GMF-TG; n=97). *P < 0.05 vs. WT mice.