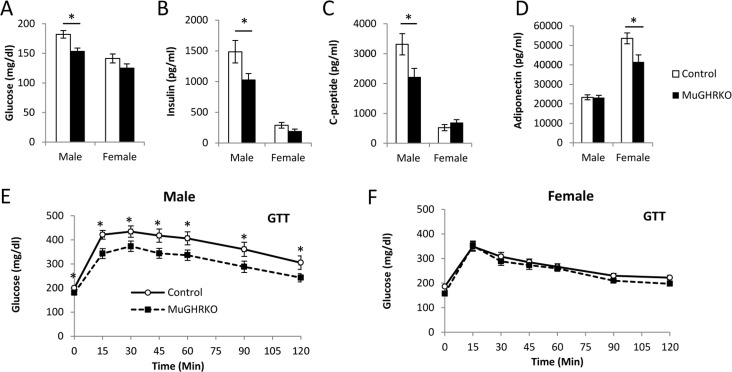
Figure 3.Measures of glucose homeostasis in male and female MuGHRKO mice(A) Fasting blood glucose, (B) insulin, (C) c-peptide, and (D) adiponectin levels are shown for male and female MuGHRKO (black bars) and controls (white bars). Glucose tolerance tests (E-F) are shown for male and female MuGHRKO (black square, dashed line) and controls (white circle, solid line). * indicates significant difference at p<0.05.