Submit an Article
Navigate
Home
Editorial Board
Editorial Policies
Current Volume
Archive
Scientific Integrity
Publication Ethics Statements
Interviews with Outstanding Authors
Newsroom
Sponsored Conferences
Podcast
Contact
Special Collections
Submit an Article
Online ISSN: 1945-4589
Research Paper
|
Volume 7, Issue 7
|
pp. 500–512
Removal of growth hormone receptor (GHR) in muscle of male mice replicates some of the health benefits seen in global GHR−/− mice
Back to article
Figure 2
(2 of 6)
−
100%
+
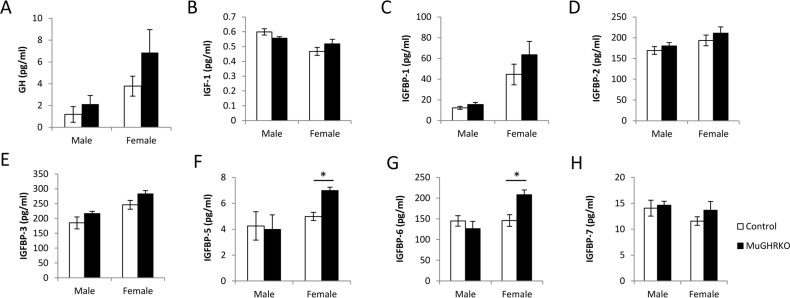
Figure 2.
Effects of muscle-specific disruption of GHR on the GH/IGF-1 axis
(
A
) GH, (
B
) IGF-1, and (
C
-
H
) IGFBP levels are shown for male and female MuGHRKO (black bars) and controls (white bars). * indicates significant difference at p<0.05.