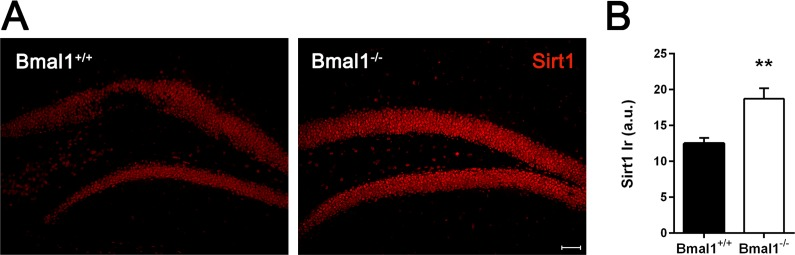
Figure 7.Sirt1‐immunoreaction was increased in Bmal1‐/‐ mice(A) Representative photomicrographs of Sirt1‐immunoreaction in DG (B) Quantification of Sirt1 immunoreaction (Ir). Sirt1‐Ir was significantly higher in Bmal1‐/‐. Values are shown as mean + SEM, **: P <0.01, scale bar = 50μm.