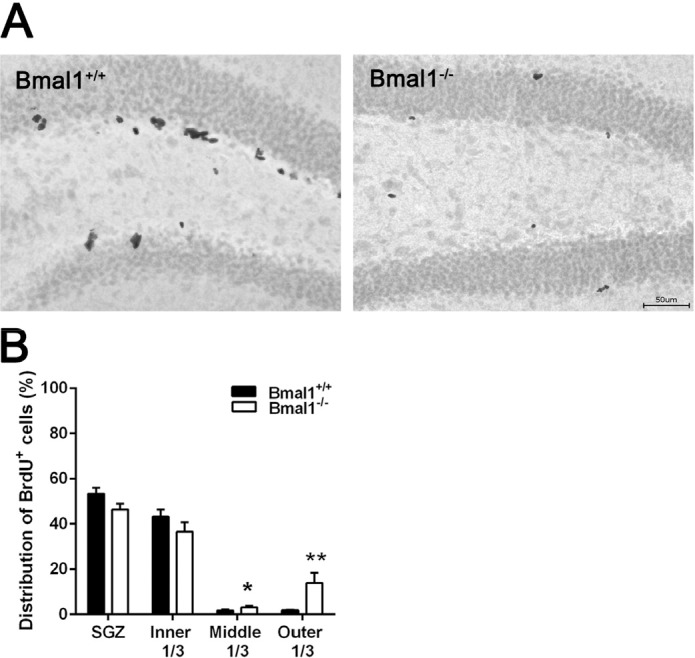
Figure 2.The spatial distribution of NPCs in DG was changed in Bmal1‐/‐ mice(A) Representative photo‐ micrograph of distribution of BrdU+ NPCs one day after the last BrdU injection. (B) In Bmal1‐/‐ a larger fraction of NPCs is located in middle and outer thirds