Submit an Article
Navigate
Home
Editorial Board
Editorial Policies
Current Volume
Archive
Scientific Integrity
Publication Ethics Statements
Interviews with Outstanding Authors
Newsroom
Sponsored Conferences
Podcast
Contact
Special Collections
Submit an Article
Online ISSN: 1945-4589
Research Paper
|
Volume 7, Issue 6
|
pp. 389–411
Transcriptome and ultrastructural changes in dystrophic Epidermolysis bullosa resemble skin aging
Back to article
Figure 1
(1 of 3)
−
100%
+
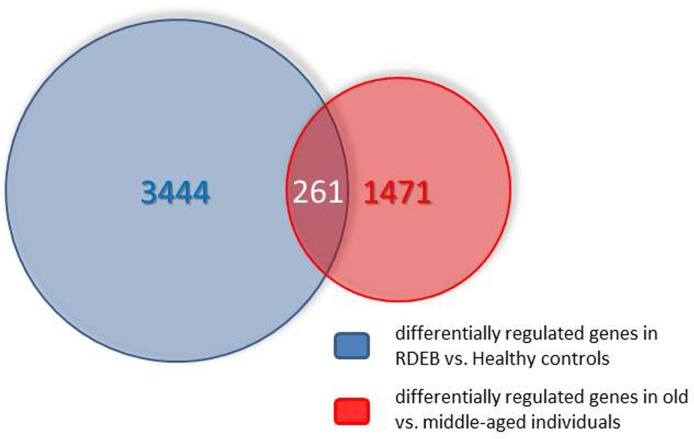
Figure 1.
Venn diagram showing the overlap of the transcripts differentially expressed in skin aging (middle aged vs. elderly probands) and in RDEB (RDEB patients vs. age and sex-matched healthy controls). For further explanations see text.