Submit an Article
Navigate
Home
Editorial Board
Editorial Policies
Current Volume
Archive
Scientific Integrity
Publication Ethics Statements
Interviews with Outstanding Authors
Newsroom
Sponsored Conferences
Podcast
Contact
Special Collections
Submit an Article
Online ISSN: 1945-4589
Research Paper
|
Volume 7, Issue 5
|
pp. 294–306
The cerebellum ages slowly according to the epigenetic clock
Back to article
Figure 6
(6 of 6)
−
100%
+
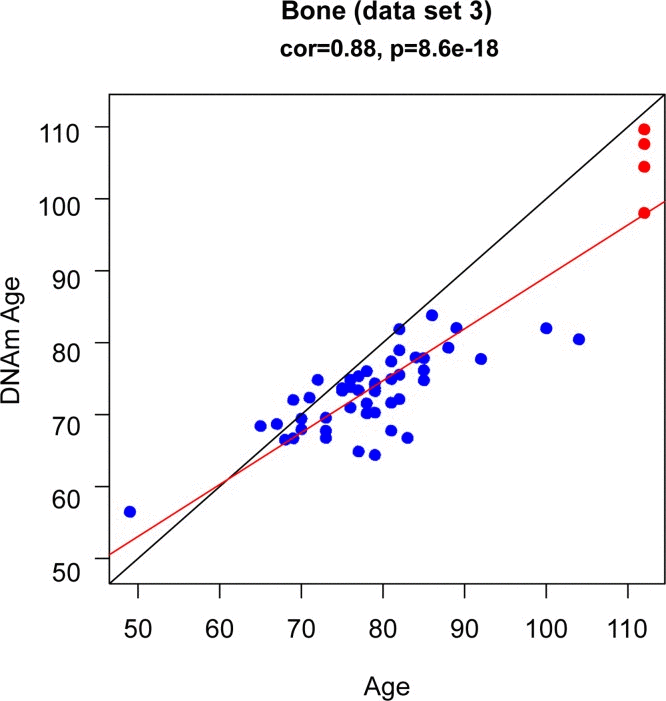
Figure 6.
DNAm age (y-axis) versus age (x-axis) in bone (osteocytes/osteoblasts)
The blue dots corresponds to the samples in data set 3 (bone). The red dots corresponds to the replicate bone samples from the 112 year old super centenarian.