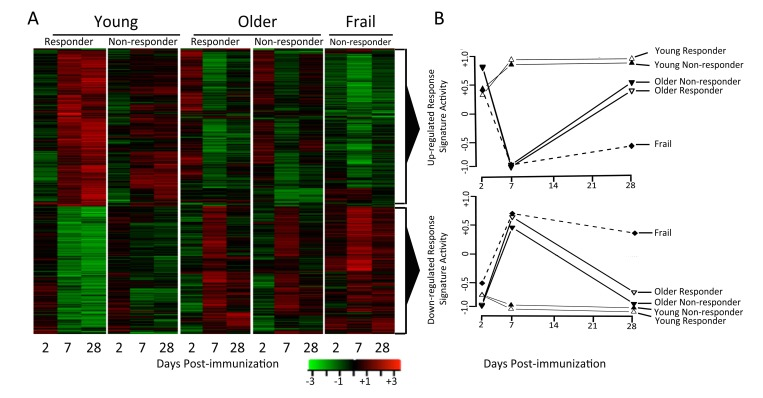
Figure 2.Young and older subjects exhibit qualitatively different responses to influenza vaccinationDifferentially-expressed genes were determined by comparing gene expression levels pre- and post-vaccination (∣fold-change∣ > 1.25 and FDR<0.05). Row-normalized fold-changes for all differentially expressed genes (rows) at each time point (columns) in the indicated cohorts are indicated in the heatmaps. Up-regulated or down-regulated response signatures were defined as the set of genes significantly up- or down-regulated in young responders. GSEA [35] was used to calculate the enrichment of these signatures in young, older and frail adults, plotted for responder and non-responder status to vaccine in the two graphs in the right-most column, where zero activity of up-regulated or down-regulated response signatures denotes absence of enrichment (note that all frail individuals were vaccine non-responders).