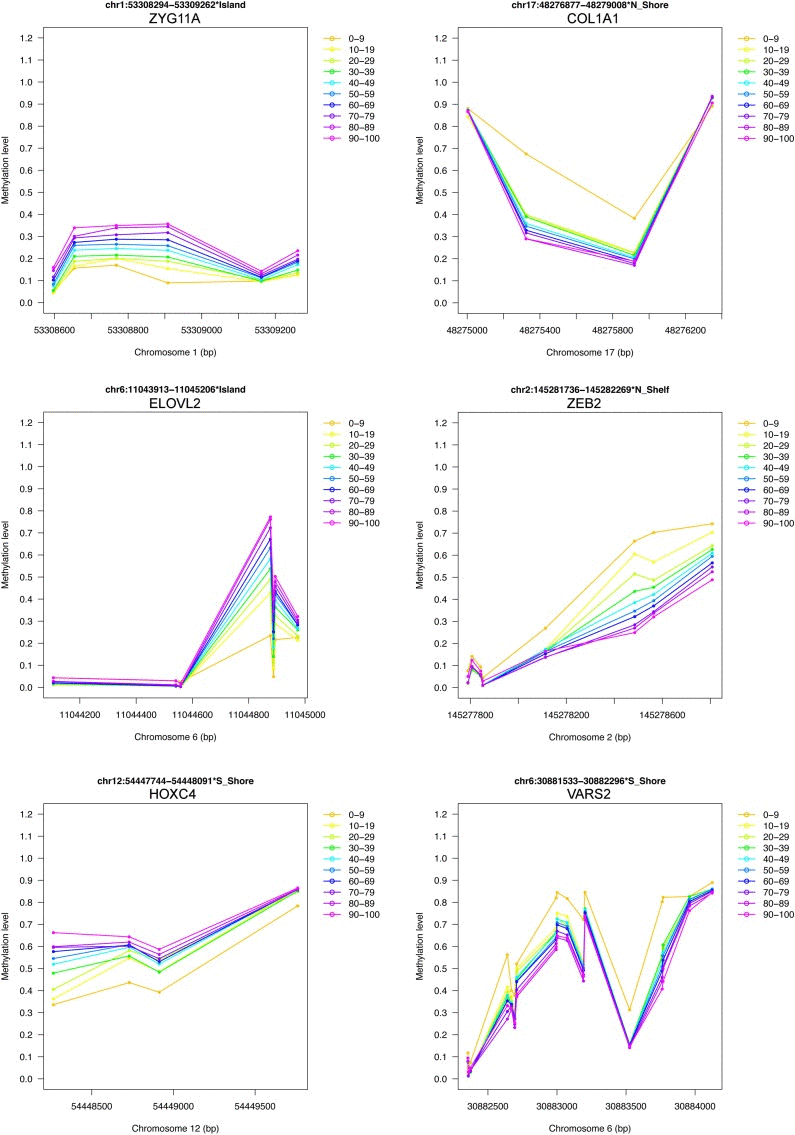
Figure 6.Examples of DNA methylation profiles of selected age-associated BOPs6 of the 42 selected BOPs are reported as an example. Mean methylation values in 10 age classes are reported for each CpG probe within the selected BOPs. For each BOP, beta-values from D1, D2 and D3 were joined together.