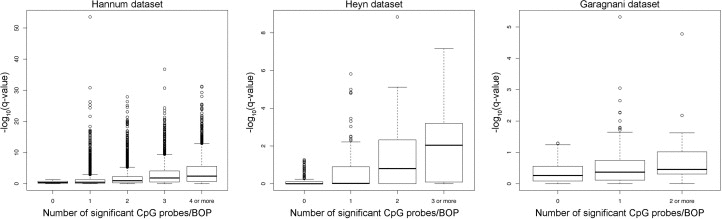
Figure 4.Number of significant CpG probes per significant BOPFor each dataset, the boxplot reports the –log10(q-value) of each significant Class A BOP (MANOVA analysis) against the number of significant CpG probes (q-value < 0.05, ANOVA analysis) included in each BOP.