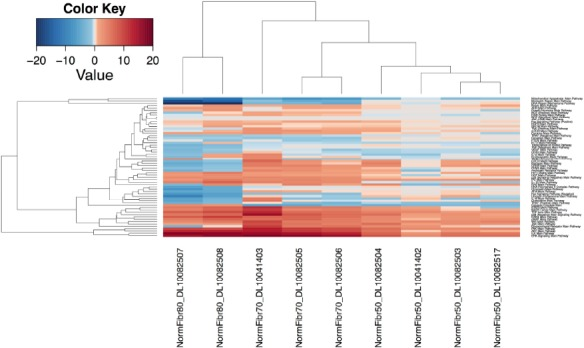
Figure 1.Unsupervised hierarchical clustering heat map of signaling pathways for dataset E-MTAB-2086. Up- and down-regulated pathways are depicted in red and blue color, respectively. The first two clustered samples on the left-hand side of schematic represent the cells with maximum passages of eighty, then follow three samples that underwent 70 passages and four samples grown for 50 passages.