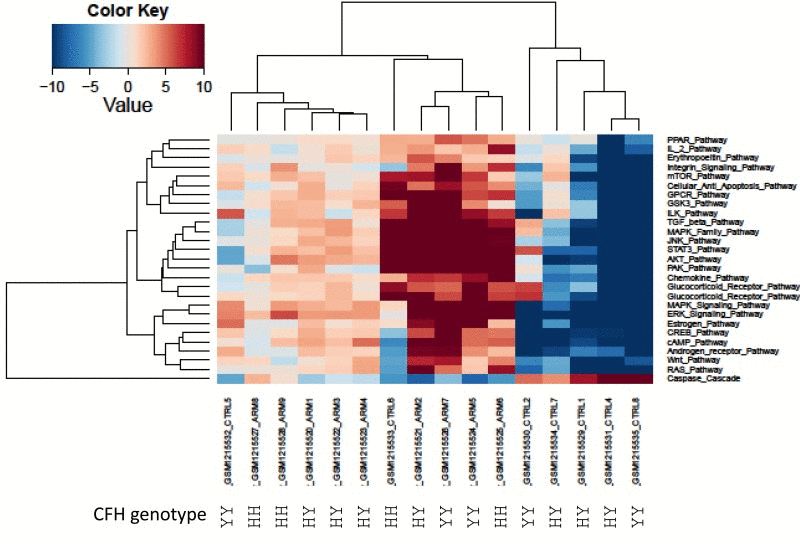
Figure 2.Heatmap of differentially activated pathways shown in Figure 1AComplement factor H genetic background (rs1061170 SNP) for PAS values derived from GSE50195 dataset shown for high-risk YH/HH and low-risk YY genotype. Blue shading indicates pathway downregulation; red shading indicates pathway upregulation. Samples with names ending in CTRL indicates control samples; samples with names ending in ARM indicates AMD samples.