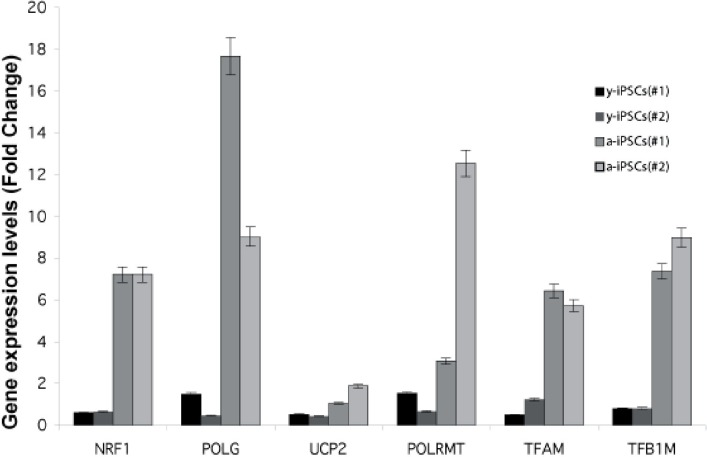
Figure 5.Gene expression analysis of genes relevant to mitochondrial biogenesis in young and aged-iPSCs at day 0Expression level of NRF1, POLG, UCP2, POLRMT, TFAM, TFB1M genes for two biological replicates (#1, #2) of y- and a-iPSCs. Data are represented as mean ± SD.