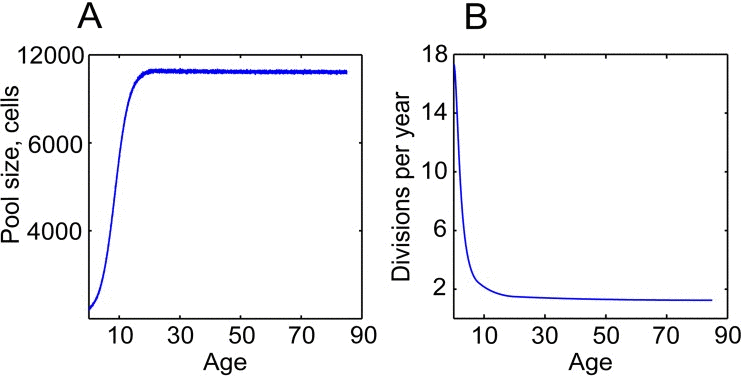
Figure 3.HSC division rates and pool size change dramatically throughout life(A) Dynamics of the pool size; the dynamics were inferred based on postnatal and adult HSC pool size estimates in [49, 72] (B) Average cell division frequencies; modeled based on estimates of HSC division rates at different ages in [20, 21, 49].