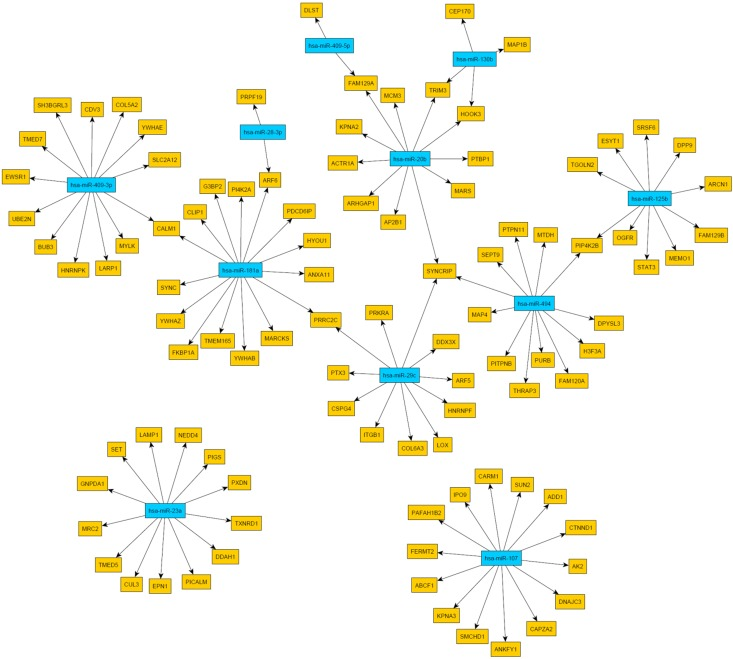
Figure 4.Network of miRNA-protein relationships obtained by the combination of target predictions and a penalized regression analysis integrating miRNA and protein expression measurementsOnly miRNAs were considered whose expression levels were associated with age. The miRNA nodes are colored blue and the identified target genes yellow.