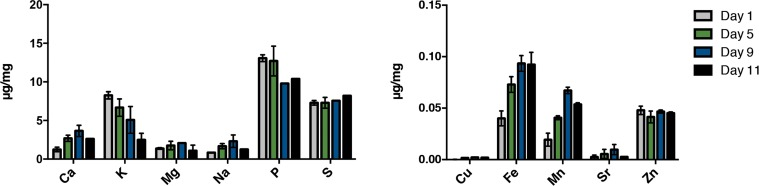
Figure 1.Alteration of the metal profile with age in C. elegans. ICPaes analysis of synchronous populations of day 1, day 5, day 9 and day 11 old animals. Metals are grouped by abundance. Bars represent the mean of three biological replicates, each in triplicate. Error bars, SD.