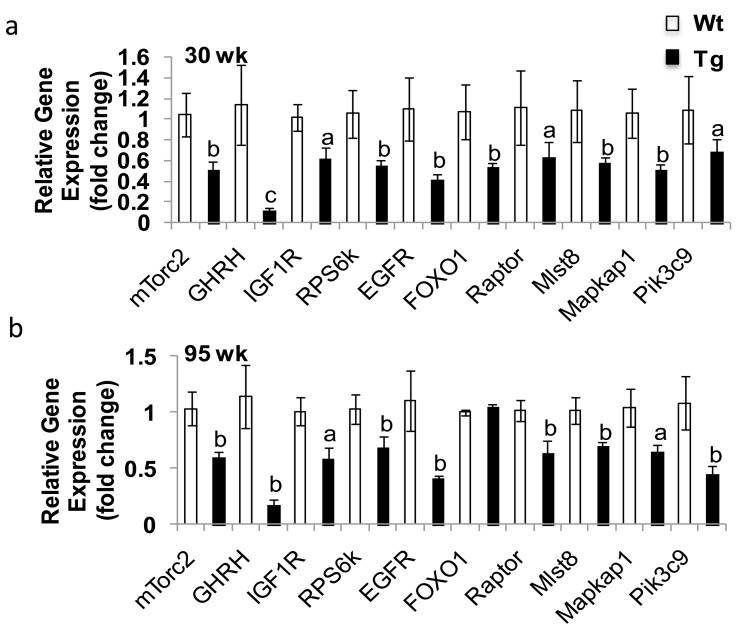
Figure 4.Gene validation from microarray resultsValidation was analyzed by qRT-PCR. (a-b), Validation of the expression of down-regulated genes from microarray study in young (30 wk, a) and old (95 wk, b) abdominal white adipose tissue (WAT) of female mice (n=6). Data are presented as mean ± SE. a, p<0.05, b, p<0.01 and c, p<0.001 as determined by Student's t-test.