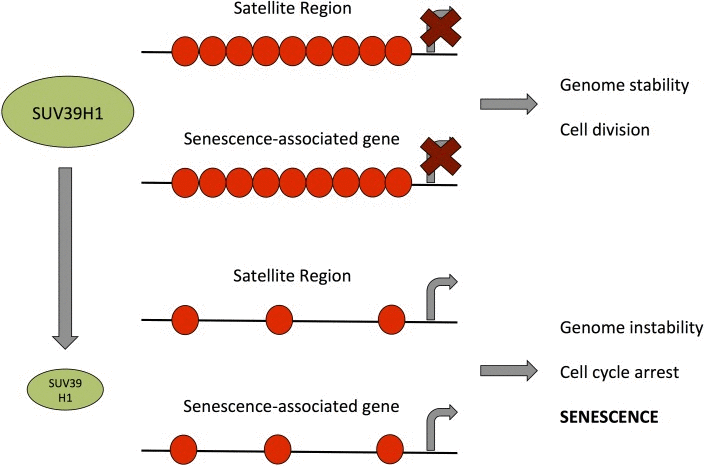
Figure 9.Model for the role of SUV39H1 down-regulation in the establishment of senescenceGreen ellipses represent the amount of SUV39H1 present in a cell, black lines represent DNA and red circles represent H3K9me3. Bent arrows indicate transcriptional activity.