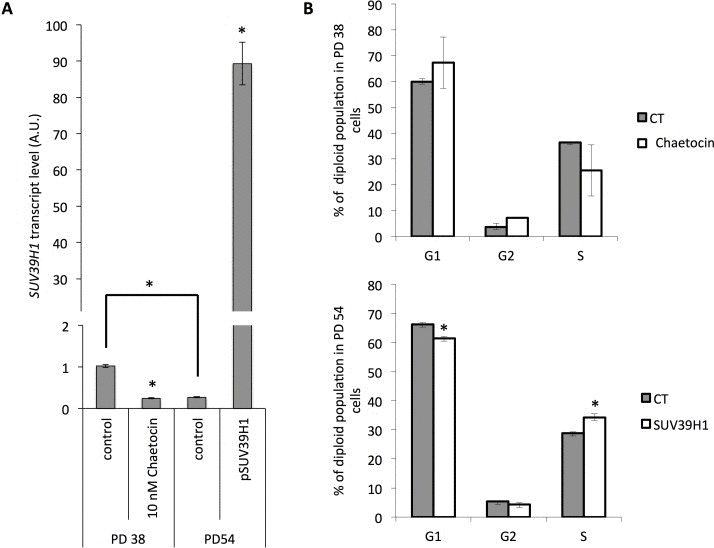
Figure 8.Modification of SUV39H1 expression levels affects cell cycle distribution(A) SUV39H1 transcript levels normalized to PD 38 control. Averages of three samples ± error progression of SDs. (B) Cell cycle distribution. Averages of three samples ± SD.