Submit an Article
Navigate
Home
Editorial Board
Editorial Policies
Current Volume
Archive
Scientific Integrity
Publication Ethics Statements
Interviews with Outstanding Authors
Newsroom
Sponsored Conferences
Podcast
Contact
Special Collections
Submit an Article
Online ISSN: 1945-4589
Research Paper
|
Volume 6, Issue 7
|
pp. 545–563
A role for SUV39H1-mediated H3K9 trimethylation in the control of genome stability and senescence in WI38 human diploid lung fibroblasts
Back to article
Figure 2
(2 of 9)
−
100%
+
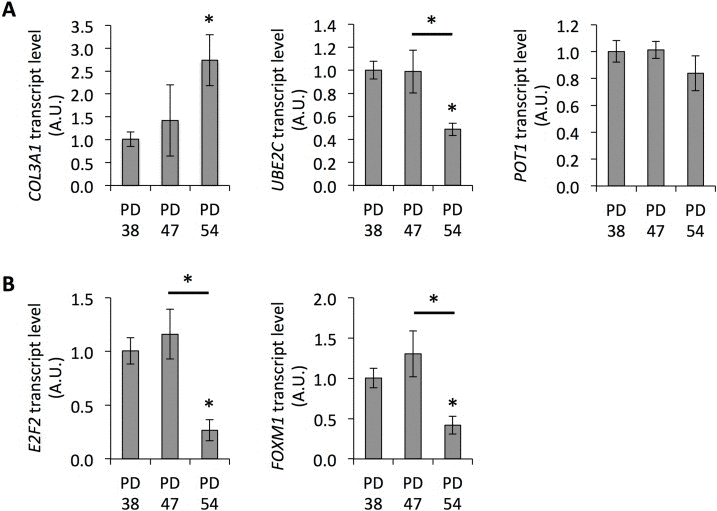
Figure 2.
Senescence-associated gene expression
Transcript levels of
COL3A1
,
POT1
, and
UBE2C
(
A
), and
E2F2
and
FOXM1
(
B
). Averages of three biological and two technical replicates ± error progression of the SDs of the technical repeats.