Submit an Article
Navigate
Home
Editorial Board
Editorial Policies
Current Volume
Archive
Scientific Integrity
Publication Ethics Statements
Interviews with Outstanding Authors
Newsroom
Sponsored Conferences
Podcast
Contact
Special Collections
Submit an Article
Online ISSN: 1945-4589
Review
|
Volume 6, Issue 6
|
pp. 432–439
Aging and DNA damage in humans: a meta-analysis study
Back to article
Figure 1
−
100%
+
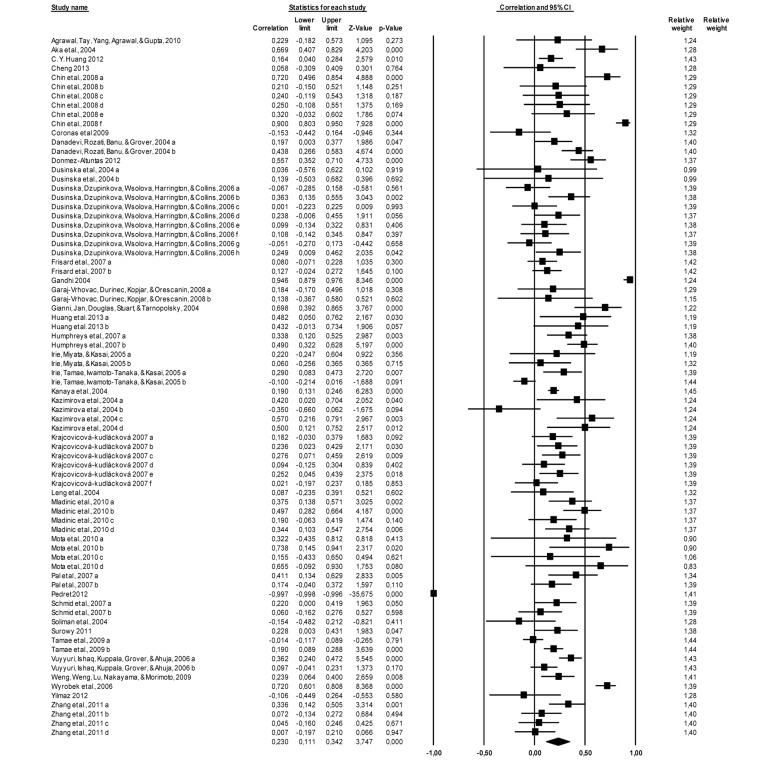
Figure 1.
Forest plot, the effect size (r) of each study (relative weight of each study in the age-related DNA damage). IC=confidence interval. a, b, c, d, e, f, g, h – different measured endpoints from the same study [
10
-
15
,
21
-
48
].