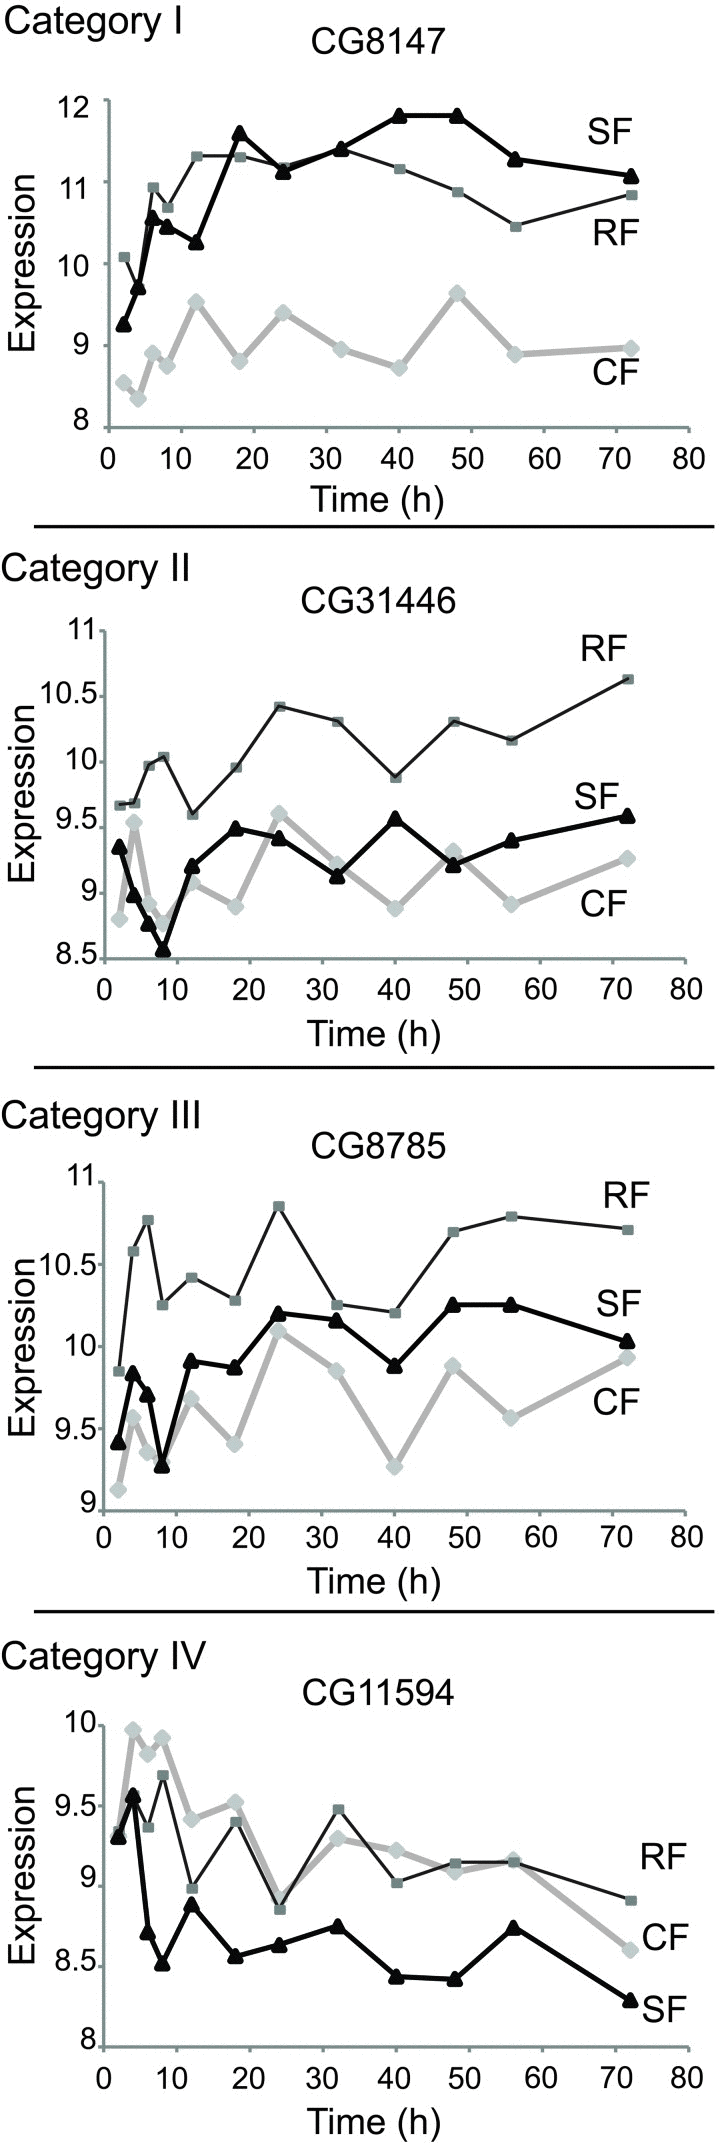
Figure 2.Expression plots of selected genes in each categoryShown are examples from each consistent category. Represented in abscises are time points (hours) after switch, in ordinates are shown the mRNA expression scores in the log2 scale
Figure 2 — Dietary switch reveals fast coordinated gene expression changes in Drosophila melanogaster | Aging