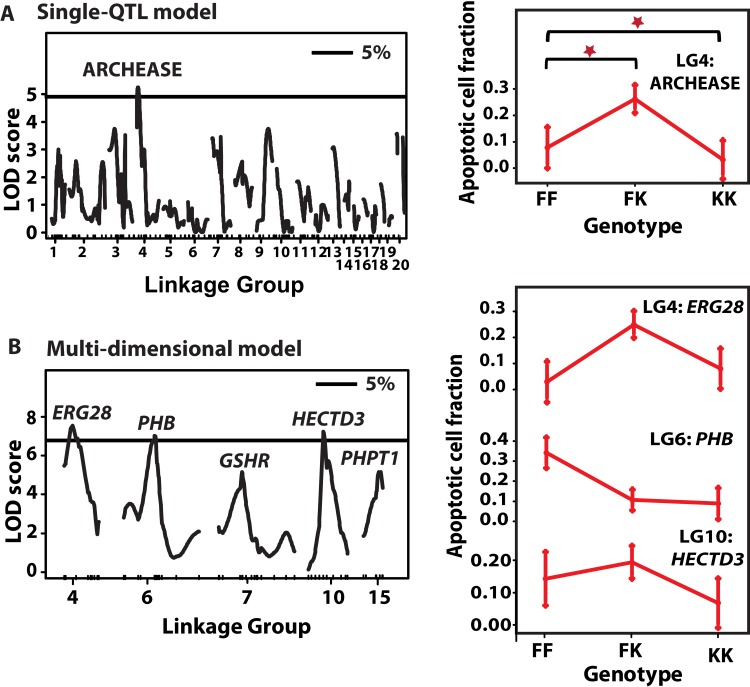
Figure 6.QTL for ACF and their allelic effects(A) Left: Single-QTL genome-wide scan. LOD scores (y-axis) are plotted against genetic distance (cM, x-axis) Horizontal line depict data-derived significant LOD score threshold (P < 0.05, permutation test). Linkage groups are shown on the x-axis and markers depicted with inner tick marks. One significant LOD peak is appeared on LG4 at marker ARCHEASE with LOD 4.78. (A) Right: QTL effects at LG4 QTL. The x-axis depicts the three genotypes at each marker – FF refers to F2 homozygous for N. furzeri GRZ allele, FK stands for heterozygous F2 and KK for F2 homozygous for the N. kadleci allele. Bars at each genotype are standard error of mean. (B) Left: Multi-QTL scan. Significant LOD score threshold, P < 0.05. Three significant LOD peaks were detected on LG4 (ERG28), LG6 (PHB), and LG10 (HECTD3), and two suggestive QTL on LG7 (GSHR) and LG15 (PHPT1). (B) Right: Effect plots of the three significant QTL.