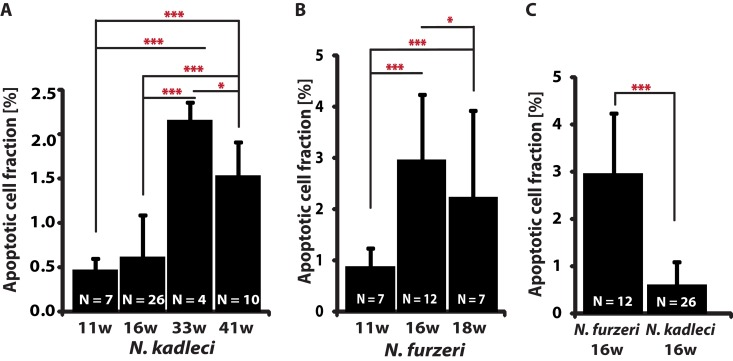
Figure 2.Apoptotic cells fraction (ACF) change with age in N. furzeri GRZ and N. kadleci(A) N. kadleci at four time points. (B) N. furzeri GRZ at three time points. (C). Comparison in age-matched samples of both species. Error bars represent standard deviation; significant differences are indicated by asterisks: (*) = P < 0.05, (**) = P < 0.01 and (***) = P < 0.001, T-test.