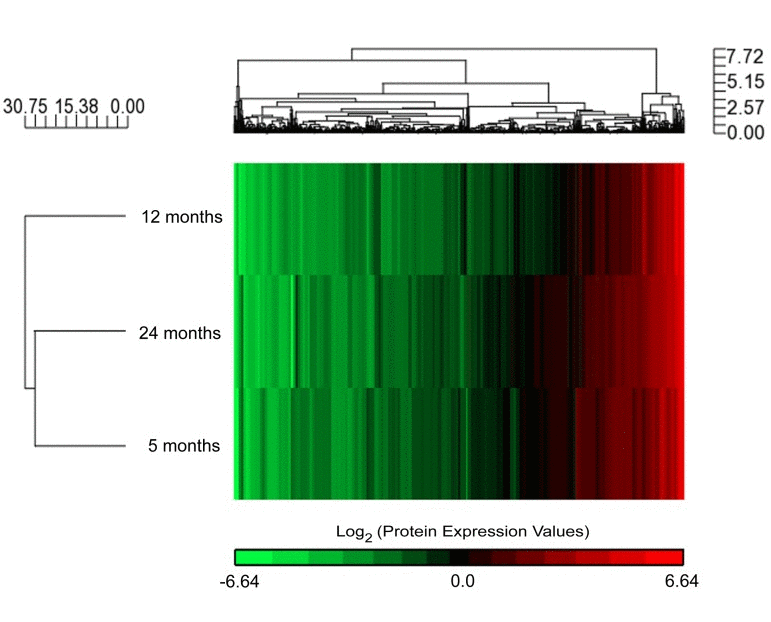
Figure 1.Aging associated synaptic mitochondrial proteomic changesExpression data derived from super-SILAC (H:L) ratios of 5, 12, and 24 month old mouse synaptic mitochondrial proteins. Hierarchical clustering analysis of log2 expression values for the common 898 identified and quantified proteins is presented here as a dendrogram.