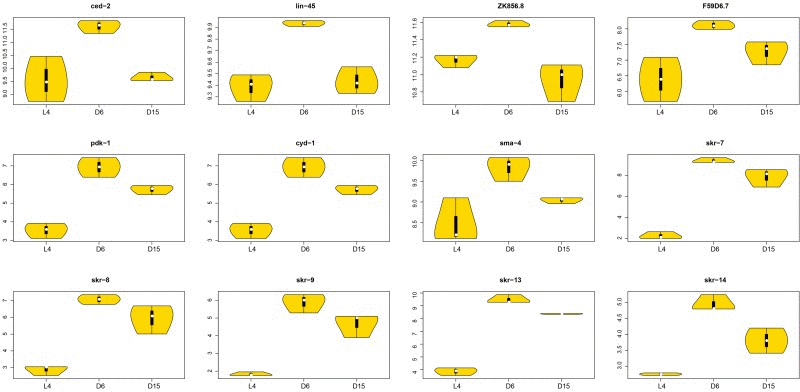
Figure 7.The violin plots of significantly associated genes in signaling pathways during agingThe violin plots showed the expression distributions of the significantly associated genes with dynamic regulation pattern in signaling pathways during aging. The X-axis represents three different stages (L4, D6 and D15); The Y-axis represents the normalized gene expression value. There were 12 genes (ced-2, lin-45, ZK856.8, F59D6.7, pdk-1, cyd-1, sma-4, and skr-7, 8, 9, 13, 14), all of which were significantly up-regulated from L4 to D6 and down-regulated from D6 to D15. The significances of each gene were shown in Table 2.
Figure 7 — Dynamic regulation of genetic pathways and targets during aging in Caenorhabditis elegans | Aging