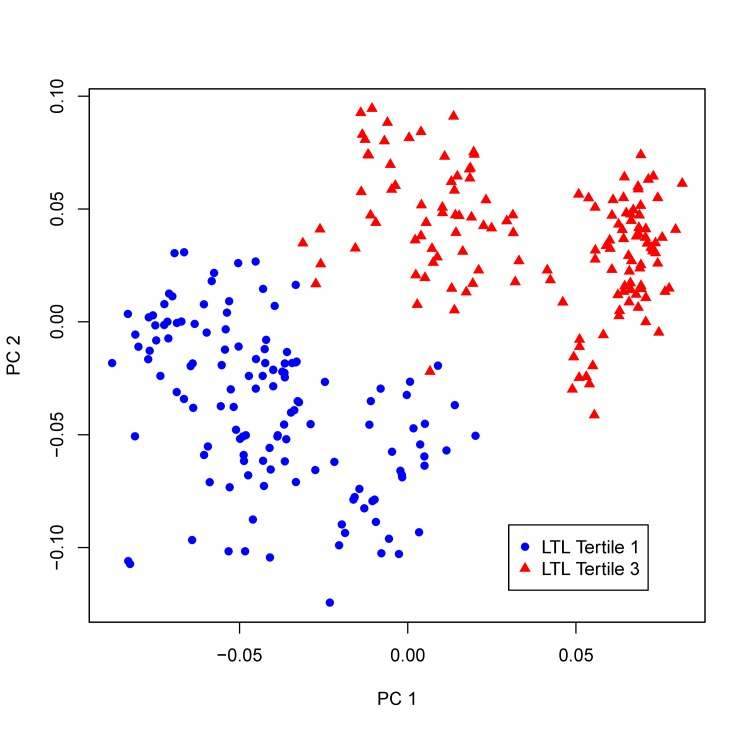
Figure 2.sPLS-DA plot. Participants whose LTL in the top tertile of LTL distribution and those in the bottom tertile are classified into two distinct groups using the multi-marker score comprising of all 19 metabolites significantly associated with LTL in the multivariate GEE model.