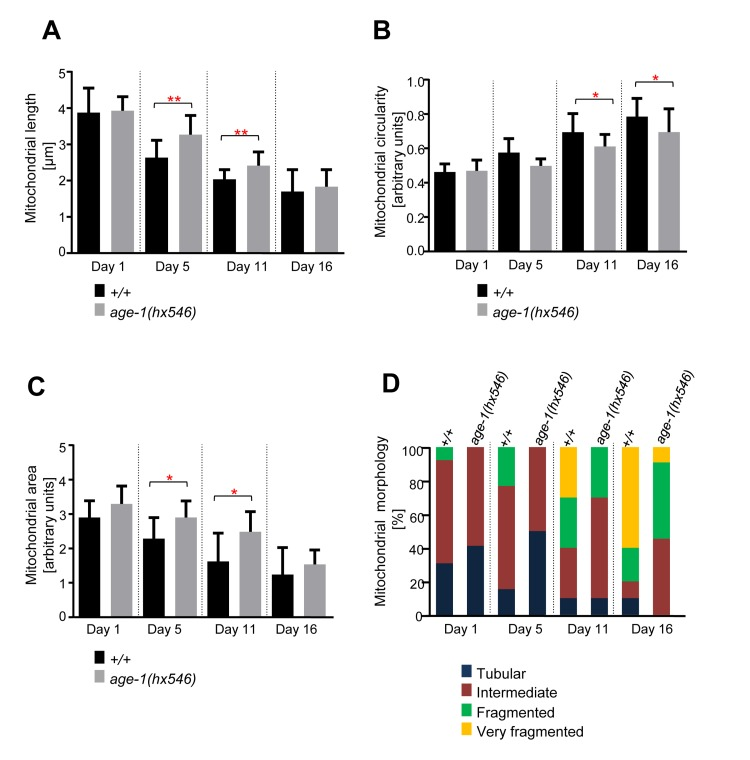
Figure 3.Age-dependent mitochondrial changes occur slower in age-1(hx546) animalsComparison of (A) mitochondrial length (n=12-17 cells), (B) circularity (n=12-17 cells), and (C) area (n=9-13 images) in wild-type animals expressing mitoGFP in body wall muscle cells (bcIs78 [Pmyo-3 mitoGFP]) and in isogenic age-1(hx546) animals (age-1(hx546); bcIs78). Error bars indicate standard deviations. Statistical significance was tested using the Student t-test (* p<0.05, ** p<0.01, *** p<0.001 and **** p<0.0001). (D) Qualitative analysis of mitochondrial morphology with age. Blue, Red, Green and Yellow represent percentage of animals displaying tubular, intermediate, fragmented and very fragmented mitochondrial morphology, respectively (n=10-17 images).