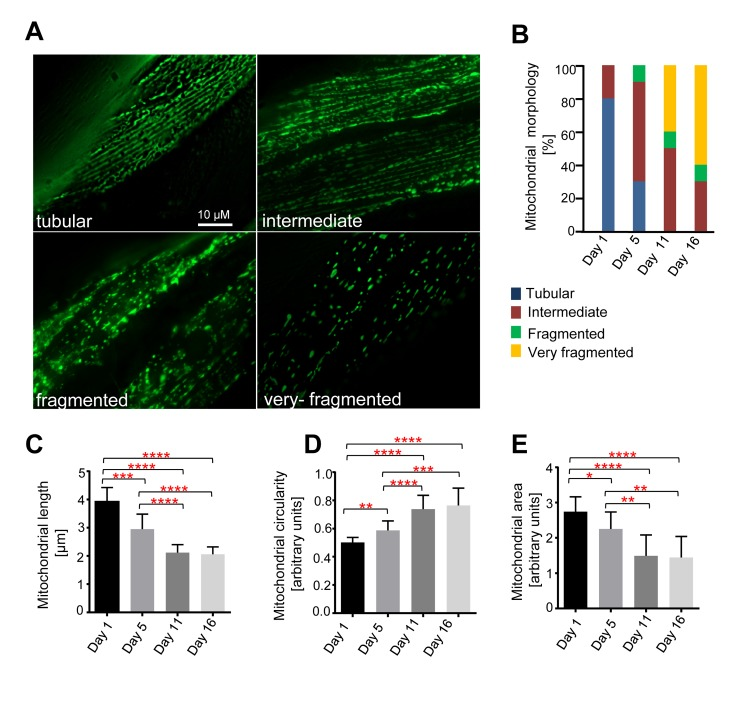
Figure 1.Age-dependent mitochondrial changes in C. elegans body wall muscle cellsTransgenic animals expressing mitoGFP in body wall muscle cells (bcIs78 [Pmyo-3 mitoGFP]) were analyzed at different days after the L4 larval stage (Day 1, Day5, Day 11 and Day 16). (A) Representative images of the different mitochondrial morphologies observed. (B) Qualitative analysis of mitochondrial morphology with age. Blue, Red, Green and Yellow represent percentage of animals displaying tubular, intermediate, fragmented and very fragmented mitochondrial morphology, respectively (n=10-13 images). Using the same dataset, mitochondrial length (n=10-13 cells) (C), circularity (n=10-13 cells) (D) and area (n=9-11 images) (E) were measured. Error bars indicate standard deviations. Statistical significance was tested using the Student t-test (* p<0.05, ** p<0.01, *** p<0.001 and **** p<0.0001).