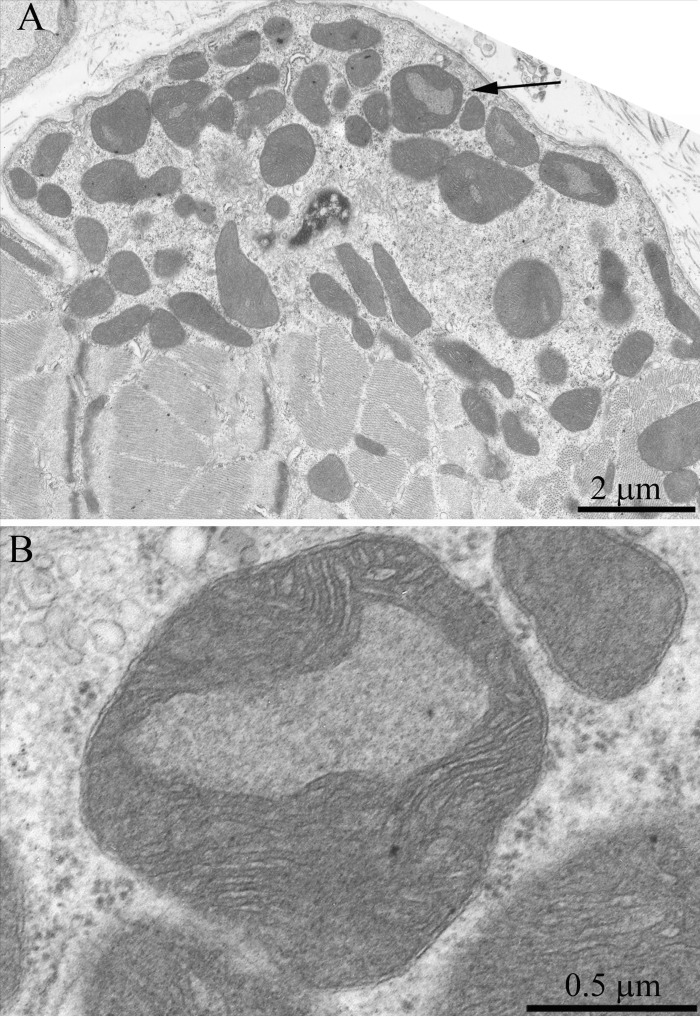
Figure 7.(A) Subsarcolemmal population of mitochondria of a three-month-old OXYS rat. The arrow indicates the mitochondrion presented in (B) at higher magnification. One can see a large cristae-free region occupied by a homogenous content of a low electron density.