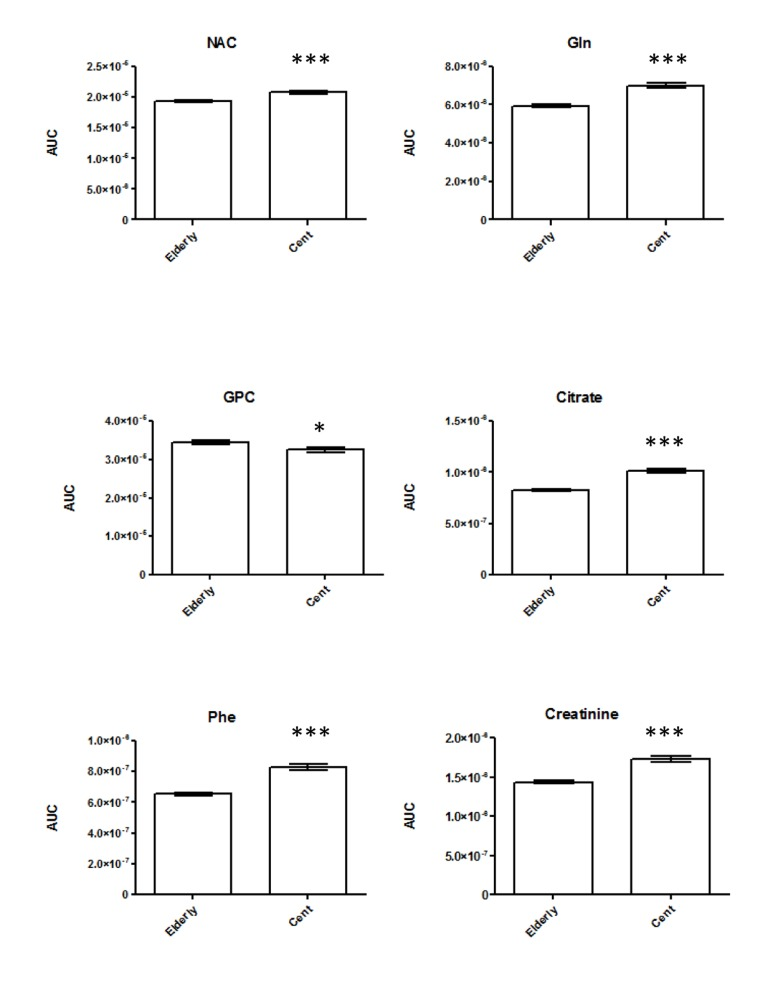
Figure 1.Bar plots representing differences in serum markers of longevity as per 1H-NMR. All significantly regulated metabolites and statistical changes are listed in Table S2.
Figure 1 — Serum profiling of healthy aging identifies phospho- and sphingolipid species as markers of human longevity | Aging