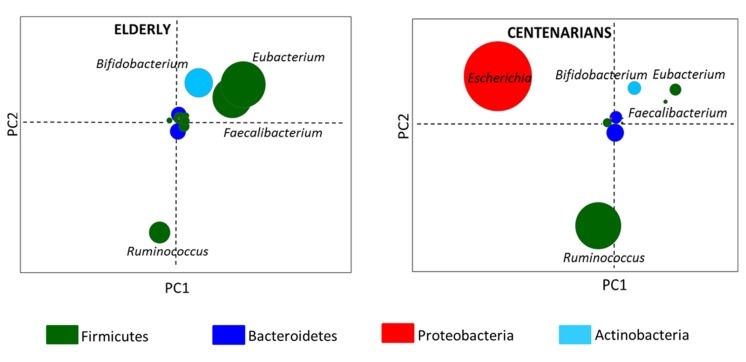
Figure 2.Taxonomic fingerprint of ageingGenus-node fingerprints were obtained using Euclidean PCoA. Each circle represents a bacterial genus colored on the basis of the phylum classification. Circle diameter is proportional to the average relative abundance of the bacterial genus in the corresponding age group.