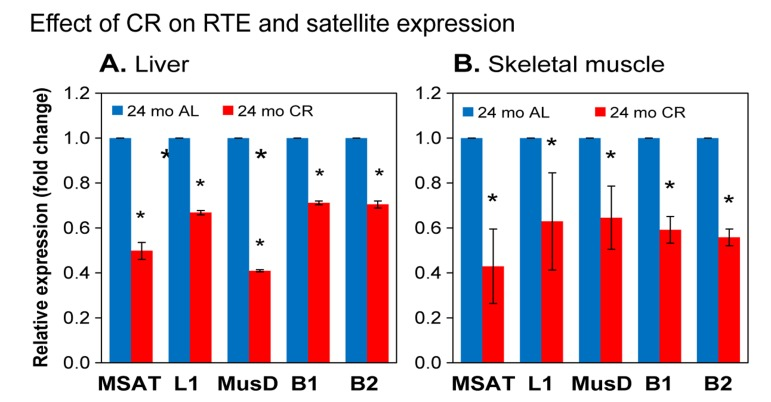
Figure 5.qPCR analysis of RTE and SE RNA expression in calorie restricted (CR) animals(A) liver; (B) skeletal muscle. Total RNA was extracted from tissues of CR animals and matched ad libitum fed (AL) controls. Experiments were performed, analyzed and presented as in Figure 4. 5 CR and 5 age-matched AL animals were used per group. Data were normalized to the 24 month AL value for each element (shown as 1.0). Means and standard deviations are shown. All pairwise comparisons were significant at p≤0.01 (*).