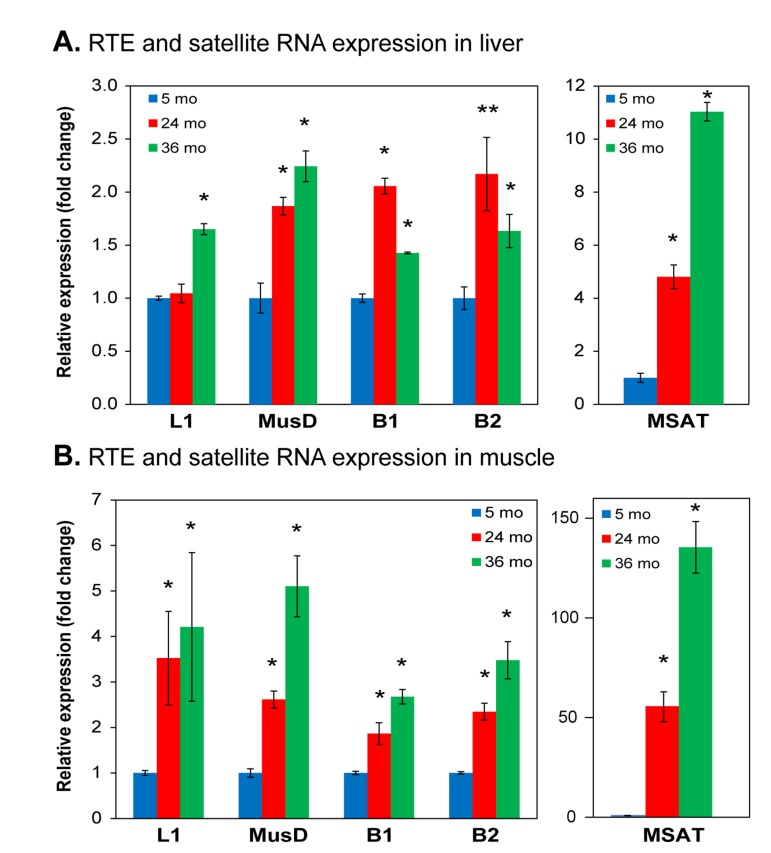
Figure 4.qPCR analysis of RNA expression of representative RTEs and SEsTotal RNA was extracted from (A) liver and (B) skeletal muscle, quantified by qPCR using indicated primers (Table S1) and normalized to GAPDH. Data were additionally normalized to the 5 month value for each element (shown as 1.0). L1, LINE L1; MusD, LTR RTE MusD/ETn; B1, SINE B1; B2, SINE B2; MSAT, major (also known as γ) SE. (*) p<0.01; (**) p≤0.05.
Figure 4 — Transposable elements become active and mobile in the genomes of aging mammalian somatic tissues | Aging