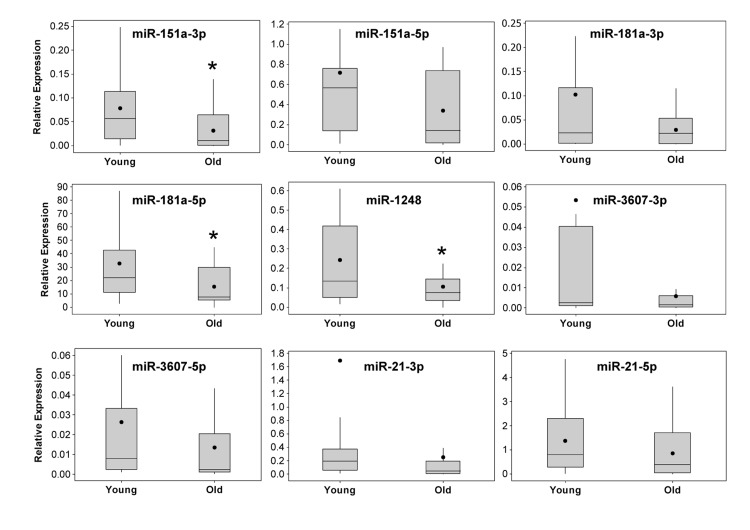
Figure 3.Real-time RT-PCR validation of miRNA expression in serum from young and old participantsThe expression levels of miRNAs identified by sequencing analysis were validated in 20 young and 20 old participant serum samples (see Table 1 for demographic information) using real-time RT-PCR. Sequence specific primers for the indicated miRNAs were used and the data was normalized to miR-191. Box and whisker plots for each miRNA are shown. Whiskers represent ± the standard deviation, the box extends to upper and lower quartiles, lines represent the median and closed circles represent the mean. *P<0.05 comparing young and old by Student's t-test.