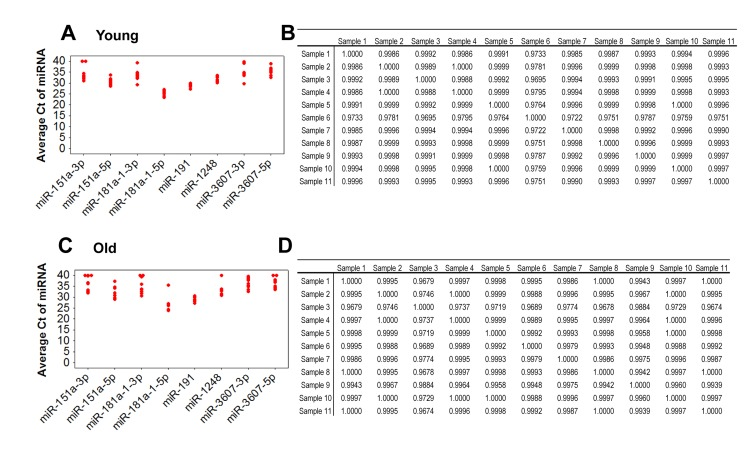
Figure 2.Comparison of expression variance of 8 miRNAs in 11 young and 11 old individuals by real-time RT-PCRRNA isolated from serum was reverse transcribed and real-time RT-PCR was performed with miRNA specific primers. Data was normalized to miR-191. Ct values of each miRNA for each young (A) and old (C) participant. Ct values were used for analysis of the Pearson correlation coefficient of miRNA expression between young participant samples (B) and between old participant samples (D). R values are indicated and a value of 1 indicates perfect correlation.