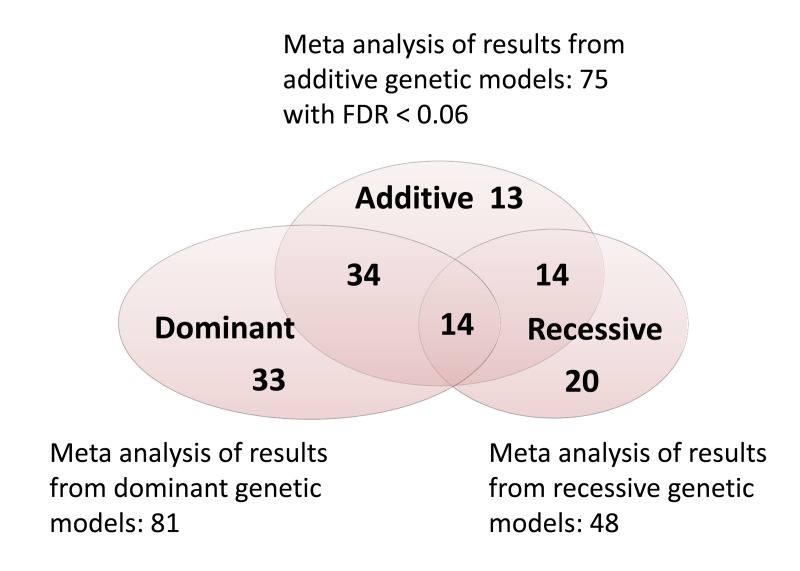
Figure 1.Venn diagram showing the number of significant associations from the meta-analysis of additive, dominant and recessive models when a 6% false discovery rate (FDR) was used. Genotypes were called using the top-strand rule and dominant and recessive models were coded for the top-strand allele A as explained in methods.