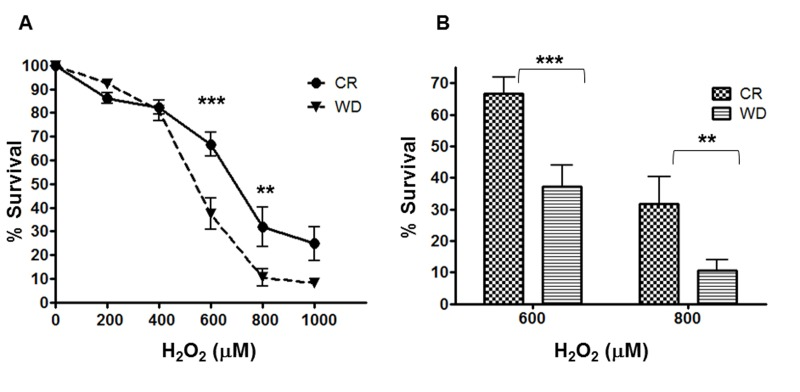
Figure 4.Differential Stress Resistance to hydrogen peroxide. A human fibroblast cell line (BJ) was cultured 48-hrs with sera from CR and WD individuals. Cell viability (WST1 assay) was determined after a 24 h treatment with H2O2 (0 – 1000 M). Data are represented as means ± SEM. P- values were determined with 2way ANOVA with Bonferroni post test. ***P < 0.001; **P < 0.01