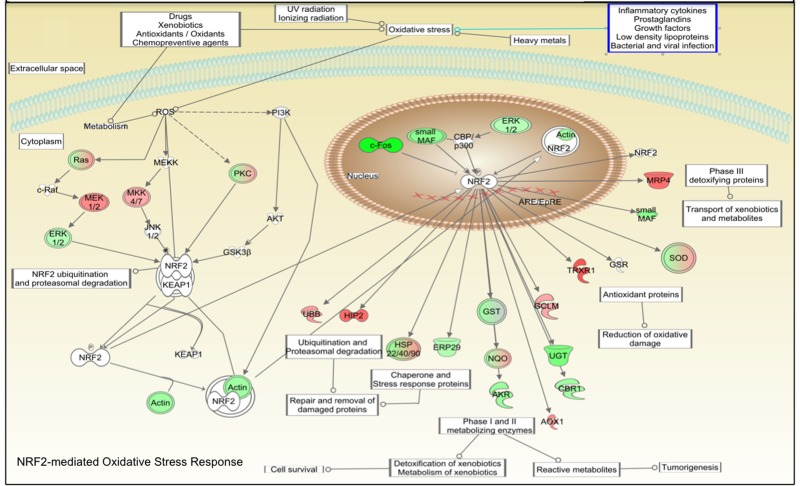
Figure 2.Connectivity map of NRF2-mediated oxidative stress response adapted from IPA software. Pathways analysis identified the NRF2-mediated oxidative stress response pathway with a statistically significant value (BH p-value 3.33E-02). Green colored shapes represent up-regulated genes while red ones represent down-regulated genes of fibroblast cell lines treated 48 hours with CR serum.