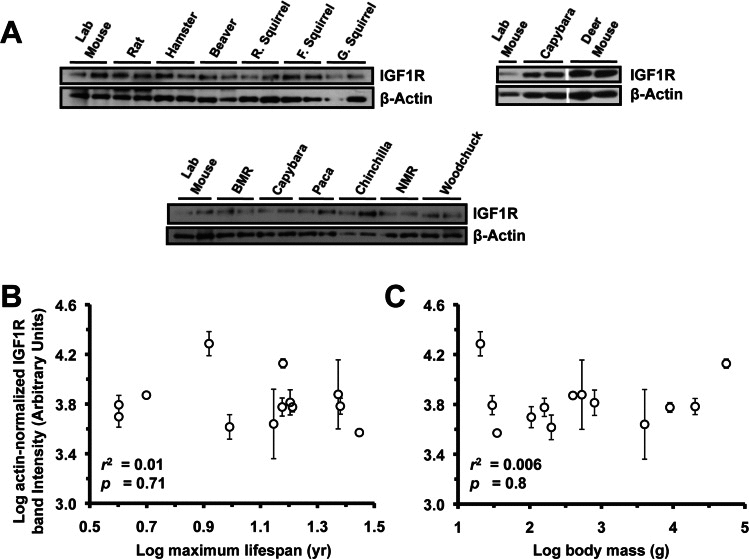
Figure 5.Levels of IGF1R protein in kidney tissue do not correlate with lifespan or body mass. (A) Western blots showing IGF1R and actin bands. (B) Log-transformed graph of IGF1R intensity plotted against maximum lifespan shows no correlation. (C) Log-transformed graph of IGF1R intensity plotted against average adult body mass shows no correlation. Error bars are s.d.